
Flow performance
Measure flow throughput capacity against current and maximum load in Bitrix24
Ücretsiz
-
Değerlendirme
-
Kurulum sayısı11033
-
GeliştiriciAlaio, inc
Açıklama
Flow Throughput shows the actual number of tasks a flow processes per period and compares current load against average and maximum capacity. It is built for operations managers who need to understand whether a flow is operating within its capacity or is overloaded.
Why businesses use it
Understanding throughput — how many tasks a flow completes per time unit — is essential for capacity management. Managers need to see average and maximum capacity, current load levels, and how many tasks are overdue or still in progress.
Business value
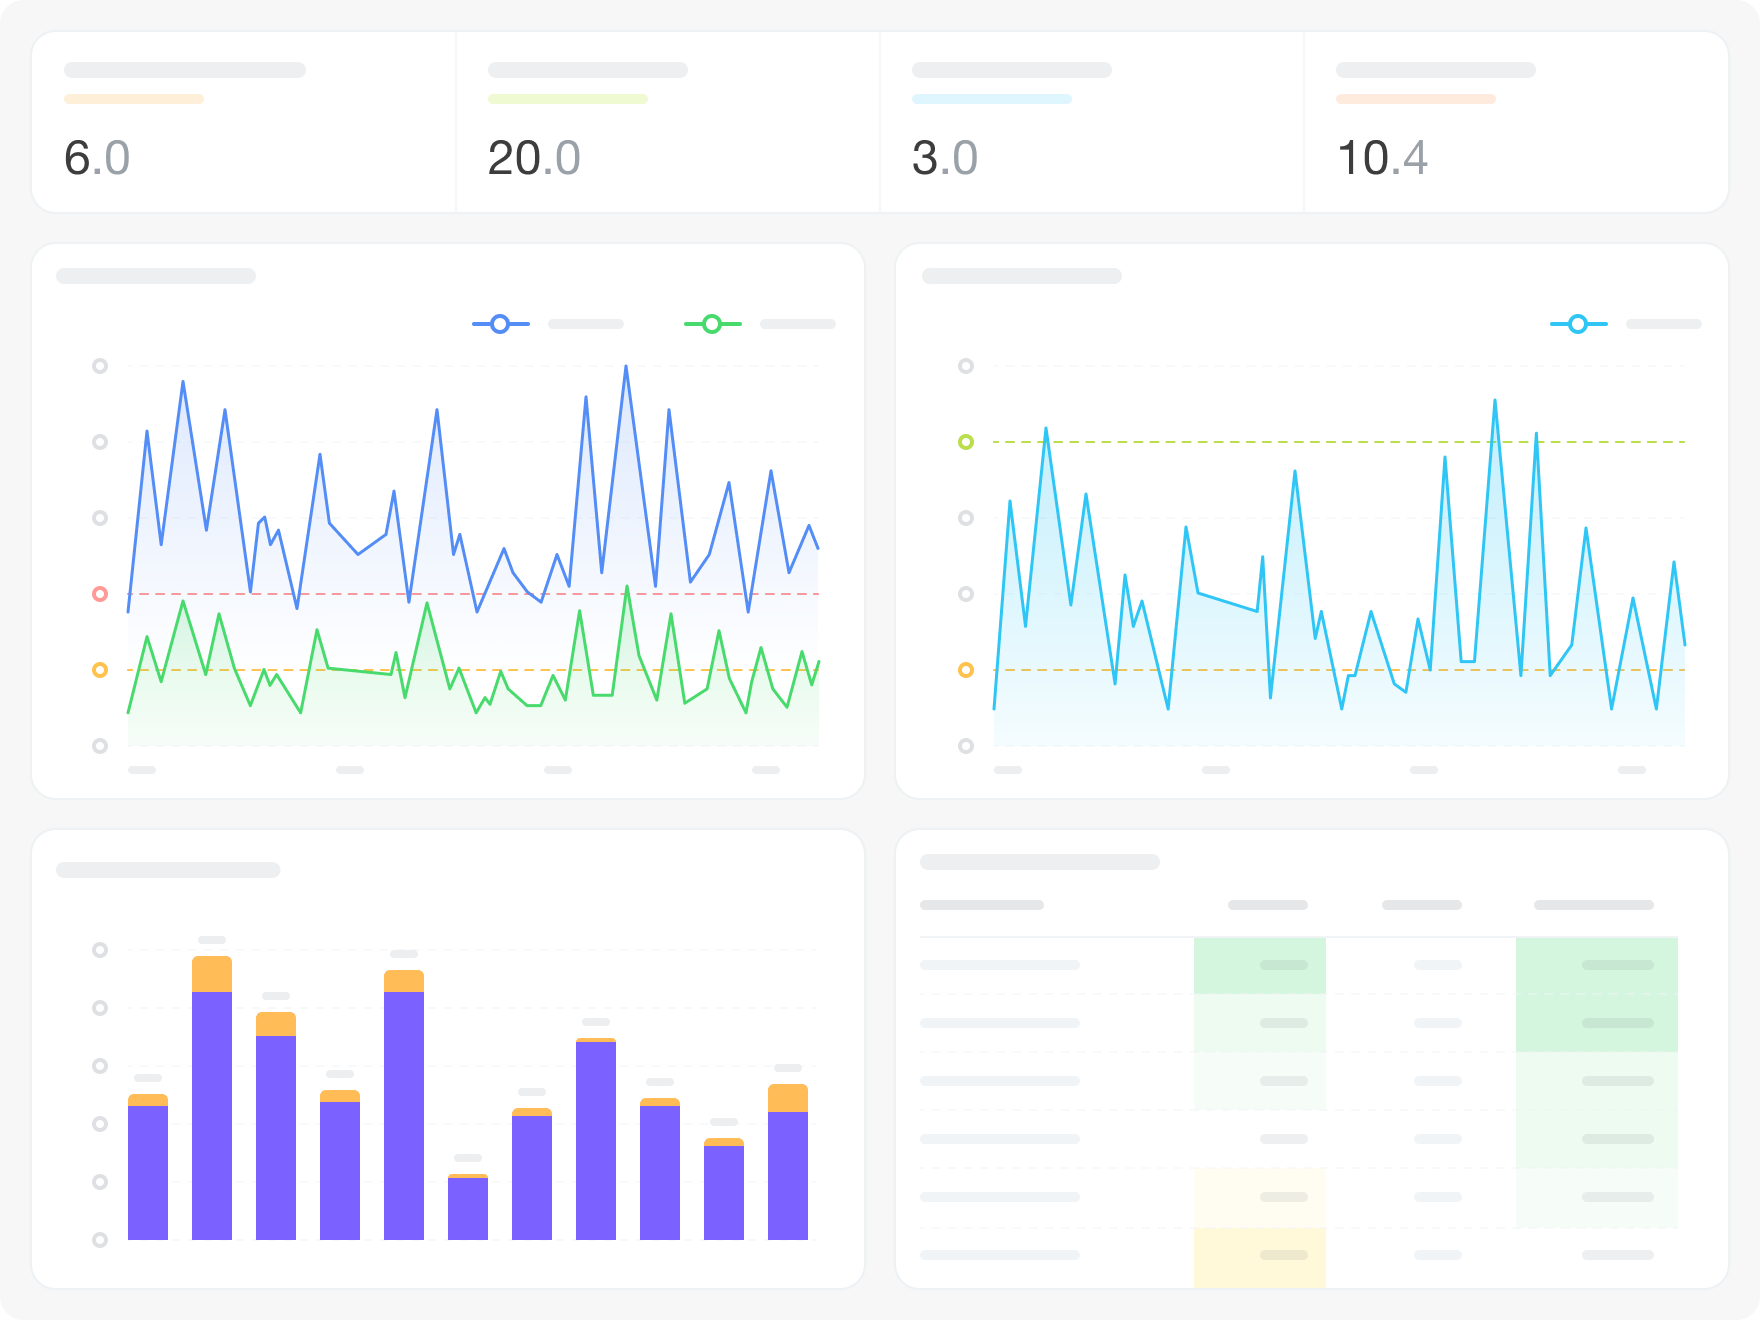
The dashboard connects to Bitrix24 Flows data. Fourteen visualizations cover: average throughput per assignee KPI, average throughput for the flow KPI, throughput per assignee dynamics chart, completed tasks bar chart, current assignee load percentage, gauge showing current load vs. average capacity, gauge showing current load vs. maximum capacity, assignee summary table, SLA execution time KPI, flow load area chart, maximum throughput per assignee KPI, maximum throughput for the flow KPI, overdue tasks in flow KPI, and tasks in progress in flow KPI. Filters: Period, Department, Assignee, Include overdue tasks.
FAQ
Why businesses use it
Understanding throughput — how many tasks a flow completes per time unit — is essential for capacity management. Managers need to see average and maximum capacity, current load levels, and how many tasks are overdue or still in progress.
Business value
- See average and maximum throughput capacity — for the whole flow and per assignee
- Compare current flow load against average and maximum capacity via gauge charts
- Track completed tasks, tasks in progress, and overdue tasks in the flow
- Monitor assignee load percentages and individual throughput
- Check whether current flow load is within normal capacity or above maximum
- Compare per-assignee throughput to identify uneven workload distribution
- Track how many tasks are overdue in the flow at any given time
- Use SLA time data to understand expected task execution duration
The dashboard connects to Bitrix24 Flows data. Fourteen visualizations cover: average throughput per assignee KPI, average throughput for the flow KPI, throughput per assignee dynamics chart, completed tasks bar chart, current assignee load percentage, gauge showing current load vs. average capacity, gauge showing current load vs. maximum capacity, assignee summary table, SLA execution time KPI, flow load area chart, maximum throughput per assignee KPI, maximum throughput for the flow KPI, overdue tasks in flow KPI, and tasks in progress in flow KPI. Filters: Period, Department, Assignee, Include overdue tasks.
FAQ
- We're not sure if our flow is running at capacity or is already overloaded. How do we find out quickly?
- Throughput varies a lot week to week and we can't tell if it's a staffing issue or something structural. What should I look at?
- We have an SLA commitment for task completion in our flow and want to monitor whether we're meeting it. Where is that tracked?
- What is needed to connect to Bitrix24?

Sürüm geçmişi
Sürüm 2
bug fixes
28.05.2025


